Plotting Data with Mu
The plotter (contributed by Adafruit makes it easy to visualise numeric data which your code may create.
The output is in the form of a line chart, with time running along the x (horizontal) axis and your data values plotted along the y (vertical) axis.
To activate the plotter in those modes that support it, simply toggle it on or off by clicking the “Plotter” button.
When the plotter is active it begins to listen for a valid source of data. This could be your Python program, something in the REPL or serial data coming from a connected device.
In all instances the pattern of valid data is the same: a Python tuple
containing only numeric data printed to a new line. In case you’re wondering,
a tuple in Python is a collection of data enclosed by parentheis, and looks
like this: (1, 2, 3).
Each item in the tuple will be plotted on a separate line in the line chart. So, if you have three sources of data, each time you emit a tuple it will have three numbers in it, one for each source of data.
The usual pattern for emitting tuples is to do so in a loop.
You MUST include a short pause somewhere in your loop for the plotter to work correctly.
Otherwise there's a danger that your code will flood the plotter with data, it won't be able to keep up and will complain.
The pause can be very small, but it still has to be there. The best
way to achieve this is to use Python's
time.sleep() (measuring in
seconds) or
microbit.sleep() (measuring in
milliseconds) to achieve this.
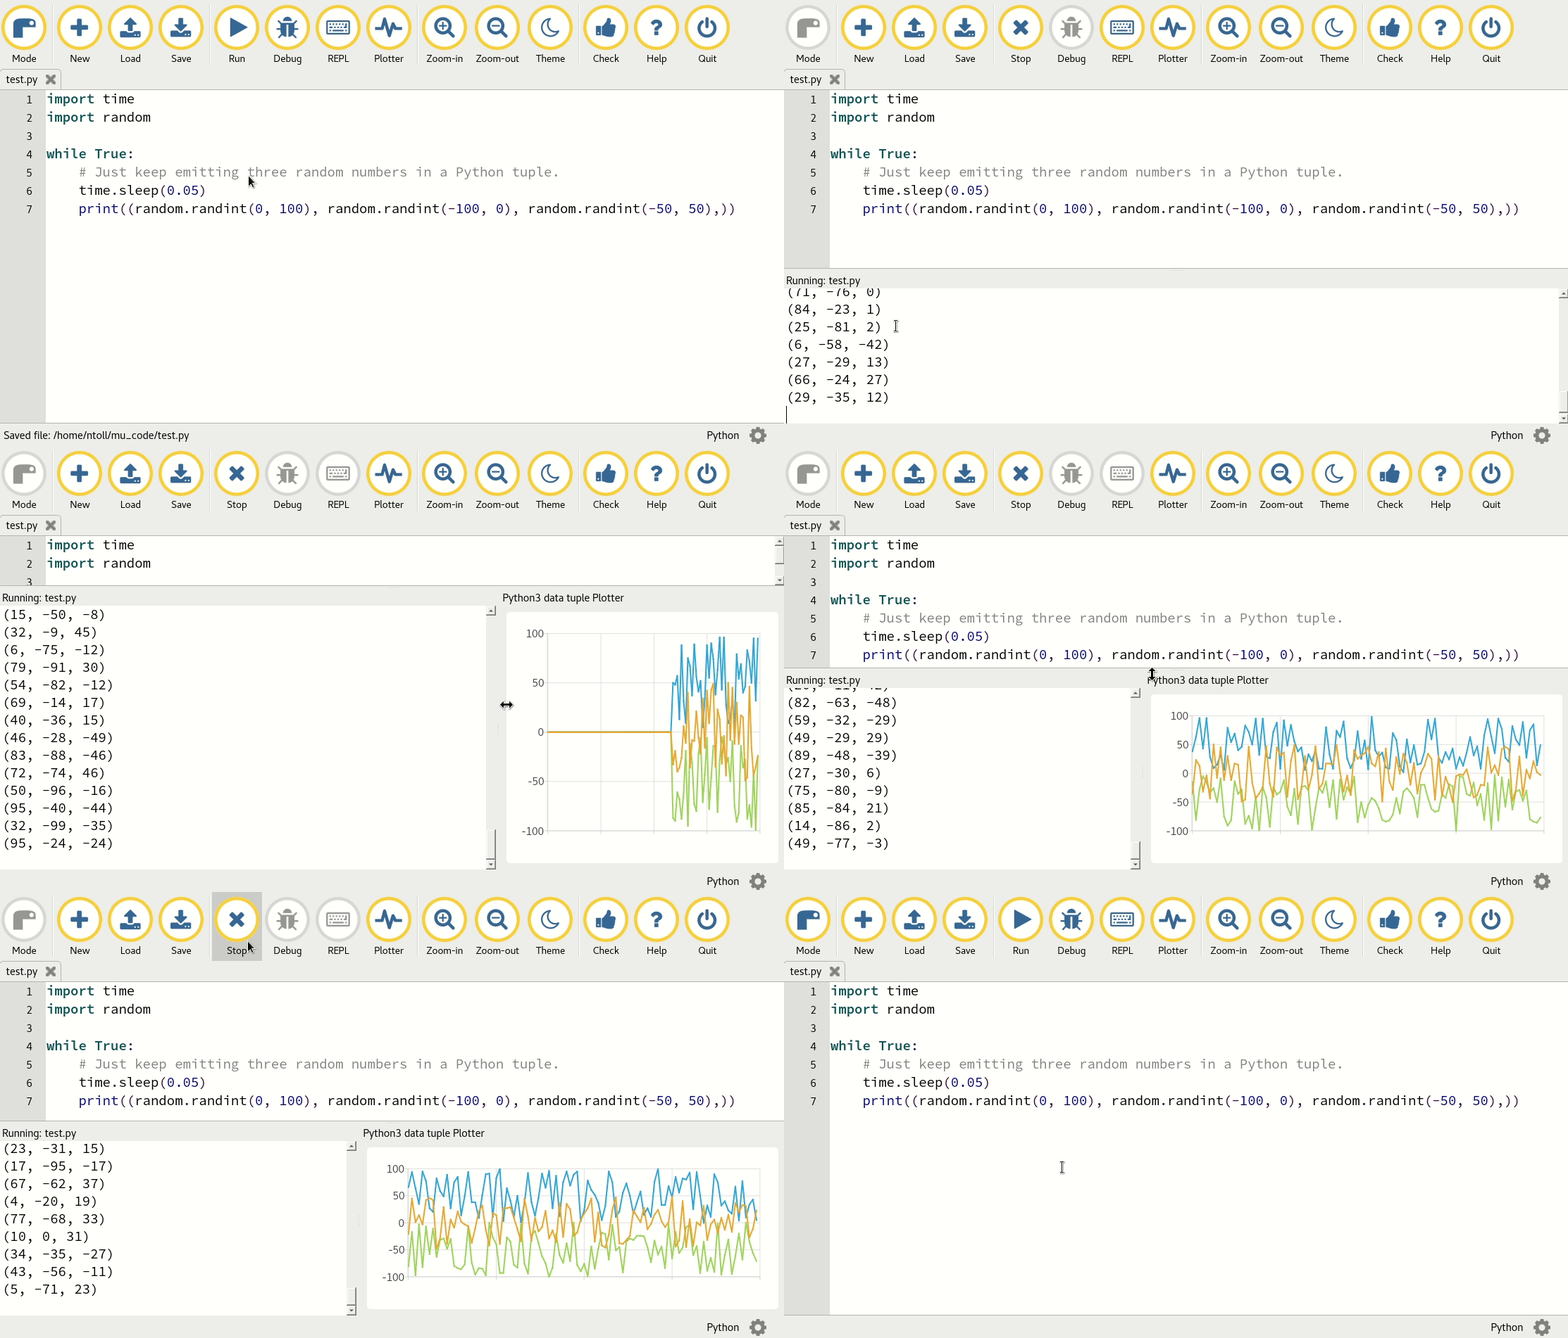
All of the above will be clear from an example which creates three random sources of data for the plotter:
import time
import random

while True:
    # Just keep emitting three random numbers in a Python tuple.
    time.sleep(0.05)
    print((random.randint(0, 100), random.randint(-100, 0), random.randint(-50, 50)))
To be clear, the following is good data:
(1, 2, 3)
(2, 3, 4)
(3, 4, 5)
(4, 5, 6)
These are examples of bad data:
1, 2, 3
2, 3, 4
3, 4, 5
(Emitting just numbers, rather than numbers in a tuple.)
(1, 2, 3)(2, 3, 4)(3, 4, 5)
(Emitting tuples, but not on a new line.)
[1, 2, 3]
[2, 3, 4]
[3, 4, 5]
(Emitting lists, rather than tuples.)
That’s it! This whole process is shown below…

Finally, Adafruit have done a bunch of awesome videos presenting how to use the plotter with various sensors. Check this one out and follow the link to YouTube to watch the rest.
